20 KiB
20 KiB
import matplotlib.pyplot as plt
import numpy as np
from ipywidgets import FileUpload
import pandas as pd
import io
import json
Upload File
uploaded = FileUpload(accept=".csv")
display(uploaded)
FileUpload(value=(), accept='.csv', description='Upload')
for f in uploaded.value:
    content = f["content"]
    df = pd.read_csv(io.BytesIO(content))
    break
df
| Year | CSIRO Adjusted Sea Level | Lower Error Bound | Upper Error Bound | NOAA Adjusted Sea Level | |
|---|---|---|---|---|---|
| 0 | 1880 | 0.000000 | -0.952756 | 0.952756 | NaN |
| 1 | 1881 | 0.220472 | -0.732283 | 1.173228 | NaN |
| 2 | 1882 | -0.440945 | -1.346457 | 0.464567 | NaN |
| 3 | 1883 | -0.232283 | -1.129921 | 0.665354 | NaN |
| 4 | 1884 | 0.590551 | -0.283465 | 1.464567 | NaN |
| ... | ... | ... | ... | ... | ... |
| 129 | 2009 | 8.586614 | 8.311024 | 8.862205 | 8.046354 |
| 130 | 2010 | 8.901575 | 8.618110 | 9.185039 | 8.122973 |
| 131 | 2011 | 8.964567 | 8.661417 | 9.267717 | 8.053065 |
| 132 | 2012 | 9.326772 | 8.992126 | 9.661417 | 8.457058 |
| 133 | 2013 | 8.980315 | 8.622047 | 9.338583 | 8.546648 |
134 rows × 5 columns
Provide CSV file URL as interactive input
url = input("Provide direct url of CSV file: ")
df = pd.read_csv(url)
df
# https://github.com/jasperdebie/VisInfo/raw/master/us-state-capitals.csv
Provide direct url of CSV file: https://github.com/jasperdebie/VisInfo/raw/master/us-state-capitals.csv
| name | description | latitude | longitude | |
|---|---|---|---|---|
| 0 | Alabama | Montgomery | 32.377716 | -86.300568 |
| 1 | Alaska | Juneau | 58.301598 | -134.420212 |
| 2 | Arizona | Phoenix | 33.448143 | -112.096962 |
| 3 | Arkansas | Little Rock | 34.746613 | -92.288986 |
| 4 | California | Sacramento | 38.576668 | -121.493629 |
| 5 | Colorado | Denver | 39.739227 | -104.984856 |
| 6 | Connecticut | Hartford<br> | 41.764046 | -72.682198 |
| 7 | Delaware | Dover | 39.157307 | -75.519722 |
| 8 | Hawaii | Honolulu | 21.307442 | -157.857376 |
| 9 | Florida | Tallahassee | 30.438118 | -84.281296 |
| 10 | Georgia | Atlanta<br> | 33.749027 | -84.388229 |
| 11 | Idaho | Boise | 43.617775 | -116.199722 |
| 12 | Illinois | Springfield | 39.798363 | -89.654961 |
| 13 | Indiana | Indianapolis | 39.768623 | -86.162643 |
| 14 | Iowa | Des Moines | 41.591087 | -93.603729 |
| 15 | Kansas | Topeka | 39.048191 | -95.677956 |
| 16 | Kentucky | Frankfort | 38.186722 | -84.875374 |
| 17 | Louisiana | Baton Rouge | 30.457069 | -91.187393 |
| 18 | Maine | Augusta | 44.307167 | -69.781693 |
| 19 | Maryland | Annapolis | 38.978764 | -76.490936 |
| 20 | Massachusetts | Boston | 42.358162 | -71.063698 |
| 21 | Michigan | Lansing | 42.733635 | -84.555328 |
| 22 | Minnesota | St. Paul | 44.955097 | -93.102211 |
| 23 | Mississippi | Jackson | 32.303848 | -90.182106 |
| 24 | Missouri | Jefferson City | 38.579201 | -92.172935 |
| 25 | Montana | Helena | 46.585709 | -112.018417 |
| 26 | Nebraska | Lincoln | 40.808075 | -96.699654 |
| 27 | Nevada | Carson City | 39.163914 | -119.766121 |
| 28 | New Hampshire | Concord | 43.206898 | -71.537994 |
| 29 | New Jersey | Trenton | 40.220596 | -74.769913 |
| 30 | New Mexico | Santa Fe | 35.682240 | -105.939728 |
| 31 | North Carolina | Raleigh | 35.780430 | -78.639099 |
| 32 | North Dakota | Bismarck | 46.820850 | -100.783318 |
| 33 | New York | Albany | 42.652843 | -73.757874 |
| 34 | Ohio | Columbus | 39.961346 | -82.999069 |
| 35 | Oklahoma | Oklahoma City | 35.492207 | -97.503342 |
| 36 | Oregon | Salem | 44.938461 | -123.030403 |
| 37 | Pennsylvania | Harrisburg | 40.264378 | -76.883598 |
| 38 | Rhode Island | Providence | 41.830914 | -71.414963 |
| 39 | South Carolina | Columbia | 34.000343 | -81.033211 |
| 40 | South Dakota | Pierre | 44.367031 | -100.346405 |
| 41 | Tennessee | Nashville | 36.165810 | -86.784241 |
| 42 | Texas | Austin | 30.274670 | -97.740349 |
| 43 | Utah | Salt Lake City | 40.777477 | -111.888237 |
| 44 | Vermont | Montpelier | 44.262436 | -72.580536 |
| 45 | Virginia | Richmond | 37.538857 | -77.433640 |
| 46 | Washington | Olympia | 47.035805 | -122.905014 |
| 47 | West Virginia | Charleston | 38.336246 | -81.612328 |
| 48 | Wisconsin | Madison | 43.074684 | -89.384445 |
| 49 | Wyoming | Cheyenne | 41.140259 | -104.820236 |
# source: https://public.opendatasoft.com/explore/dataset/us-state-boundaries/table/
with open("us-state-boundaries.csv") as f:
    sb = [line.split(';')[-2] for line in f.readlines()[1:]] # state boundaries
    sb = ['[['+b[b.find("[[[")+3: b.find("]]]")+1].strip('[').strip(']')+']]' for b in sb]

sb2 = []
for i in range(len(sb)):
    try:
        sb2.append(json.loads(sb[i]))
    except BaseException as e:
        print(i)

sb3 = []
for b in sb2:
    x = []
    y = []
    for xy in b:
        x.append(xy[0])
        y.append(xy[1])
    sb3.append([x, y])

print(sb3[0])
3
[[-64.843729999672, -64.8306170004155, -64.8166740000574, -64.8003289998509, -64.7850010003439, -64.7780049999629, -64.756923000007, -64.7438040000044, -64.7376500004207, -64.7298299996841, -64.727025000328, -64.7081970000824, -64.7016040001075, -64.6832930000708, -64.6752489999265, -64.6684810000495, -64.6404370000478, -64.6391440000621, -64.643689000191, -64.6377349997255, -64.6638549997298, -64.6613010004438, -64.6642589999609, -64.6782290000832, -64.6944889999008, -64.7079069996541, -64.720173999712, -64.7487359997476, -64.7577690001039, -64.7734199996511, -64.7828909996753, -64.8012889997506, -64.7992609999961, -64.8027730004303, -64.8068909998636, -64.8185169998639, -64.8333530001747, -64.849551999893, -64.8580350004284, -64.8725339995569, -64.8897519996245, -64.8997750000177, -64.9052399998634, -64.9061510002576, -64.921034000424, -64.9337140000354, -64.9420610001283, -64.9464720003629, -64.9609639998188, -64.9804139998553, -64.9978610002517, -65.0198210000917, -65.0315650000928, -65.0485809995957, -65.0501940001468, -65.0577479998463, -65.0677319998815, -65.0809529999913, -65.10083099965, -65.1172670000931, -65.1312199995987, -65.1426220001913, -65.1477229999889, -65.154117999597, -65.1536439999441, -65.1506989999476, -65.1448089999545, -65.137688999725, -65.1399409997855, -65.1351379999137, -65.1303469997376, -65.1174269999267, -65.1130569997, -65.1137599996818, -65.112214999801, -65.1004130000736, -65.091790999621, -65.0805670002019, -65.0606650002537, -65.0415220003638, -65.0172989996944, -65.007769000119, -64.9995900002555, -64.9823889999064, -64.9691820000403, -64.950455000077, -64.9426920001401, -64.9276419995691, -64.907594999856, -64.8950240000245, -64.8910329999146, -64.8739119999314, -64.8649759996594, -64.8599500002049, -64.843729999672], [18.3937130003038, 18.3952020001978, 18.4029059996947, 18.4075949997621, 18.4038019999373, 18.386209000173, 18.3766859999062, 18.3781310002826, 18.3762170003899, 18.3779449996133, 18.3747250001871, 18.373742000052, 18.3706359999168, 18.3725669997141, 18.3674629998913, 18.3655769999245, 18.363997000316, 18.3551899997673, 18.3441069997742, 18.3197589996555, 18.2853760001861, 18.2673589997501, 18.2612709996959, 18.2523160002306, 18.2487579998992, 18.2487249997681, 18.2506900002989, 18.2630590000803, 18.2608550002774, 18.2605059997401, 18.2526930002856, 18.2451059996837, 18.2293219998289, 18.2133720003843, 18.2051629999707, 18.1920609998845, 18.1834559998114, 18.1796829999945, 18.1795870003758, 18.1834839999737, 18.1942359996752, 18.2065249995874, 18.2185139997731, 18.2241929999785, 18.2288429997134, 18.2379699999478, 18.2480099999376, 18.2572230000658, 18.2560599998827, 18.2569120001884, 18.252492999917, 18.2523549996564, 18.2562770001029, 18.2667770001428, 18.2691289998076, 18.2541629999811, 18.2439080002976, 18.2364819999318, 18.2326290001953, 18.23477199986, 18.2417569995878, 18.2507890004071, 18.2590850003178, 18.2774250002881, 18.2931389997995, 18.302844999769, 18.3128859999509, 18.3205580003919, 18.3362909997264, 18.3508549999627, 18.3615369997632, 18.3802330002905, 18.3957579996876, 18.4068750001337, 18.418827, 18.4395440001859, 18.4471019997825, 18.4528070003069, 18.4597469996518, 18.4591020001661, 18.4493229999302, 18.4407029996101, 18.4455259999609, 18.4507079999187, 18.4509469999009, 18.4462940001965, 18.4541570002839, 18.4619490000909, 18.4649839999656, 18.4633640003554, 18.4621600003593, 18.4062549996746, 18.3959270002777, 18.3942250002094, 18.3937130003038]]
fig, axis = plt.subplots()
x_col = "longitude"
y_col = "latitude"
xlo = df[x_col].min() - 5
xhi = df[x_col].max() + 5
ylo = df[y_col].min() - 5
yhi = df[y_col].max() + 5
x = df[x_col].to_numpy()
y = df[y_col].to_numpy()
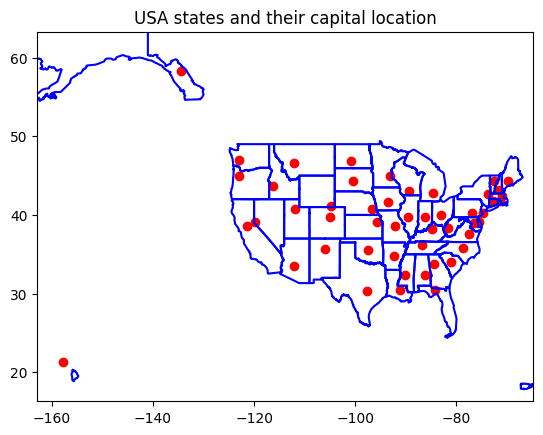
plt.axis([xlo, xhi, ylo, yhi])
plt.plot(x, y, "ro")
for b in sb3:
plt.plot(b[0], b[1], "b")
plt.title("USA states and their capital location")
plt.show()
Edit CSV file URL variable
url = "https://data.gov.au/data/dataset/7169894e-b518-4933-a900-f79ebc4ec6a3/resource/5d9edabe-b6af-4975-9340-88f55b872a00/download/soe2016antarctic5-year-smoothed-annual-max-min-temperature-by-stationaad.csv"
df = pd.read_csv(url)
df
| Year | Macquarie Island MAX | Macquarie Island MIN | Mawson MAX | Mawson MIN | Casey MAX | Casey MIN | Davis MAX | Davis MIN | |
|---|---|---|---|---|---|---|---|---|---|
| 0 | 1948 | NaN | NaN | NaN | NaN | NaN | NaN | NaN | NaN |
| 1 | 1949 | NaN | NaN | NaN | NaN | NaN | NaN | NaN | NaN |
| 2 | 1950 | 6.050 | 2.625 | NaN | NaN | NaN | NaN | NaN | NaN |
| 3 | 1951 | 6.100 | 2.660 | NaN | NaN | NaN | NaN | NaN | NaN |
| 4 | 1952 | 6.140 | 2.660 | NaN | NaN | NaN | NaN | NaN | NaN |
| ... | ... | ... | ... | ... | ... | ... | ... | ... | ... |
| 63 | 2011 | 6.740 | 3.200 | -8.04 | -14.28 | -5.86 | -12.50 | -7.00 | -12.98 |
| 64 | 2012 | 6.840 | 3.260 | -8.24 | -14.40 | -6.28 | -12.96 | -7.10 | -13.08 |
| 65 | 2013 | 6.825 | 3.225 | -8.10 | -14.30 | -6.30 | -12.90 | -7.05 | -13.05 |
| 66 | 2014 | NaN | NaN | NaN | NaN | NaN | NaN | NaN | NaN |
| 67 | 2015 | NaN | NaN | NaN | NaN | NaN | NaN | NaN | NaN |
68 rows × 9 columns
df.head(2)
| Year | Macquarie Island MAX | Macquarie Island MIN | Mawson MAX | Mawson MIN | Casey MAX | Casey MIN | Davis MAX | Davis MIN | |
|---|---|---|---|---|---|---|---|---|---|
| 0 | 1948 | NaN | NaN | NaN | NaN | NaN | NaN | NaN | NaN |
| 1 | 1949 | NaN | NaN | NaN | NaN | NaN | NaN | NaN | NaN |
col_names = df.columns.values
print(col_names)
['Year' 'Macquarie Island MAX' 'Macquarie Island MIN' 'Mawson MAX'
 'Mawson MIN' 'Casey MAX' 'Casey MIN' 'Davis MAX' 'Davis MIN']
[print(i, col_names[i]) for i in range(len(col_names))]
x_col = int(input("Input index number of column to be used for x-axis: "))
y_col = int(input("Input index number of column to be used for y-axis: "))
y_col2 = input("Input index number of column 2 (optional) to be used for y-axis: ")
y_col2 = int(y_col2) if y_col2 else None
print(f"x-axis: {col_names[x_col]}, y-axis: {col_names[y_col]}, y-axis (second): {y_col2}")
0 Year
1 Macquarie Island MAX
2 Macquarie Island MIN
3 Mawson MAX
4 Mawson MIN
5 Casey MAX
6 Casey MIN
7 Davis MAX
8 Davis MIN
Input index number of column to be used for x-axis: 0
Input index number of column to be used for y-axis: 2
Input index number of column 2 (optional) to be used for y-axis: 1
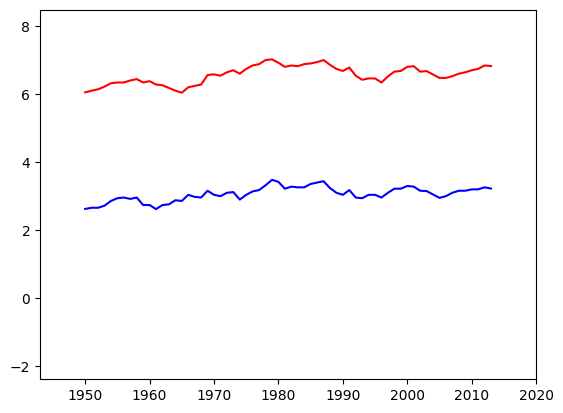
x-axis: Year, y-axis: Macquarie Island MIN, y-axis (second): 1
fig, axis = plt.subplots()
xlo = df[col_names[x_col]].min() - 5
xhi = df[col_names[x_col]].max() + 5
ylo = df[col_names[y_col]].min() - 5
yhi = df[col_names[y_col]].max() + 5
if y_col2:
    ylo = min(ylo, df[col_names[y_col2]].min() - 5)
    yhi = max(yhi, df[col_names[y_col]].max() + 5)

x = df[col_names[x_col]].to_numpy()
y = df[col_names[y_col]].to_numpy()
if y_col2:
    y2 = df[col_names[y_col2]].to_numpy()

plt.axis([xlo, xhi, ylo, yhi])
# plt.plot(x, y, "bo")
plt.plot(x, y, "b")
if y_col2:
    # plt.plot(x, y2, "ro")
    plt.plot(x, y2, "r")
plt.show()